Exercise 12.2#
Question 1#
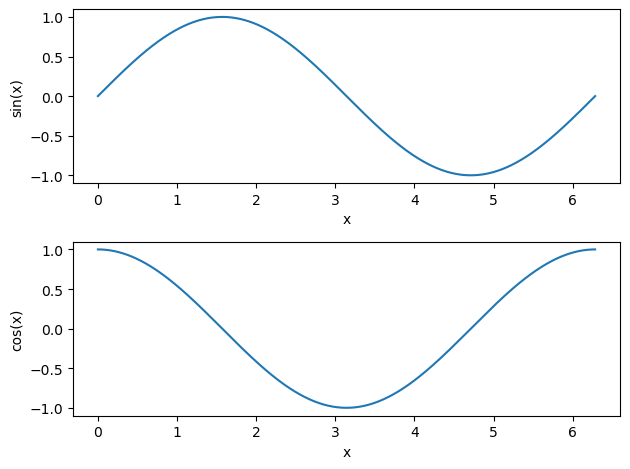
Plot \(sin(x)\) and \(cos(x)\) for \(0 < x < 2\pi\) in the same figure, but on separate axes. Arrange these axes vertically and share the x-axes. It should look something like this:
Question 2#
Ellipses can be defined by the relation:
where \(a\) is a scaling factor along the \(x\)-axis and \(b\) is a scaling factor along the \(y\)-axis. This can also be expressed using the parametric equations:
where \(s\) is a parameter ranging from \(0\) to \(2\pi\).
Write a script that creates a plot with subplots, taking two user inputs: the number of rows and the number of columns for the subplot. On each set of axes plot a full ellipse. Along the rows of the subplots, change the value of \(a\) from 1 to 100 in even increments. Change the value of \(b\) from 1 to 100 in even increments along the columns of the subplots.